ACO Public Reporting
- PRIMECAREMANAGERS
- ACO Public Reporting
ACO Name and Location
Prime Care Managers, LLC
4002 Technology Center, Longview TX 75605
ACO Primary Contact
John Ford
903-247-0484
Organizational Information
|
ACO Participants |
ACO Participant in Joint Venture |
|
Phynet Inc. |
Y |
|
Associated Clinicians of East Texas |
Y |
|
Collom & Carney Clinic Association |
Y |
|
Pulmonary & Internal Medicine of Texarkana |
N |
|
Darren J. Arnecke |
N |
|
Darren J. Arnecke M.D., P.A. |
N |
|
Dr. Bart Pruitt, PLLC |
N |
|
East Texas Clinic Association |
N |
|
Family Medical Group of Texarkana, LLP |
N |
|
Marshall Family Practice Associates, PLLC |
N |
|
Whelchel Primary Care Medicine, P.A. |
N |
|
Tyler Internal Medicine Associates, P.A, |
N |
|
Family Medical Associates, PA |
N |
ACO Governing Body
|
Member |
Membership Type |
ACO Participant Legal Name, |
|||
|
First Name |
Last Name |
Title/ Position |
Voting Power |
||
|
John |
Ford |
Board Chair |
23% |
Stakeholder |
N/A |
|
Darrell |
Bunch |
D.O. / Voting Member |
25% |
ACO Participant / Rep. |
PhyNet, Inc. |
|
James |
Logan |
M.D. / Voting Member |
8% |
ACO Participant / Rep. |
Marshall Family Practice Associates |
|
James |
Sawyer |
M.D. / Voting Member |
10% |
ACO Participant / Rep. |
Associated Clinicians of East Texas |
|
Kathleen |
Harris |
M.D. / Voting Member |
8% |
ACO Participant / Rep. |
Associated Clinicians of East Texas |
|
Micheal |
Morris |
M.D. / Voting Member |
8% |
ACO Participant / Rep. |
Associated Clinicians of East Texas |
|
Kyle |
Jones |
FNPC / Voting Member |
8% |
ACO Participant / Rep. |
Collom & Carney Clinic Association |
|
Gregory |
Richter |
M.D. / Voting Member |
8% |
ACO Participant / Rep. |
Collom & Carney Clinic Association |
|
Lee |
Thomas |
Voting Member |
2% |
Beneficiary |
N/A |
Key ACO Clinical & Administrative Leadership
ACO Executive: John Ford
Medical Director: James Sawyer, M.D., FACP
Compliance Officer: Jeanette Schaublin LVN, CCID
Quality Assurance/Improvement Officer: Jeanette Schaublin LVN, CCID
Associated Committees and Committee Leadership
|
Committee Name |
Committee Leader Name & Position |
|
Executive Committee |
John Ford, Chair |
|
Bert Ratay, Co-Chair |
|
|
Roger Hall, Co-Chair |
|
|
Quality Improvement and Assurance Committee |
Darrell Bunch DO, Chair |
|
James Sawyer MD FACP, CoChair |
|
|
Jeanette Schaublin LVN, CCID, Officer |
|
|
Health Information and Data Committee |
Jason Smith, Chair |
|
Jeanette Schaublin, Co-Chair |
|
|
Clinical Best Practices Committee |
James Sawyer, MD, FACP, Chair |
|
Darrell Bunch, DO, Co-Chair |
|
|
Jeanette Schaublin LVN, CCID, Co-Chair |
|
|
IT/Data Compliance Committee |
Jason Smith, Chair |
|
Valerie Topp, Co-Chair |
|
|
Jeanette Schaublin LVN, CCID, Co-Chair |
|
|
ACO Compliance Committee |
John Ford, Chair |
|
Jason Smith, Co-Chair |
|
|
Jeanette Schaublin LVN, CCID, Officer |
Types of ACO Participants, or Combinations of Participants, that formed the ACO
- Networks of individual practices of ACO professionals
Shared Savings and Losses
Amount of Shared Savings/Losses:
- Second Agreement Period
- Performance Year 2022, $ 4,180,487.23
- Performance Year 2021, $ 4,441,123.86
- Performance Year 2020, $ 3,997,054.67
- First Agreement
- Performance Year 2019, $ 2,929,207.96
- Performance Year 2018, $ 0.00
- Performance Year 2017, $ 0.00
Shared Savings and Losses
- Third Agreement Period
- Performance Year 2022
- Proportion invested in infrastructure: 27%
- Proportion invested in redesigned care processes/resources: 7%
- Proportion of distribution to ACO participants: 66%
- Second Agreement Period
- Performance Year 2021
- Proportion invested in infrastructure: 27%
- Proportion invested in redesigned care processes/resources: 7%
- Proportion of distribution to ACO participants: 66%
- Performance Year 2020
- Proportion invested in infrastructure: 27%
- Proportion invested in redesigned care processes/resources: 7%
- Proportion of distribution to ACO participants: 66%
- First Agreement Period
- Performance Year 2019
- Proportion invested in infrastructure: 30%
- Proportion invested in redesigned care processes/resources: 10%
- Proportion of distribution to ACO participants: 60%
- Performance Year 2017-2018
- Proportion invested in infrastructure: N/A%
- Proportion invested in redesigned care processes/resources: N/A%
- Proportion of distribution to ACO participants: N/A
2022 Quality Performance Results:
Quality performance results are based on CMS Web Interface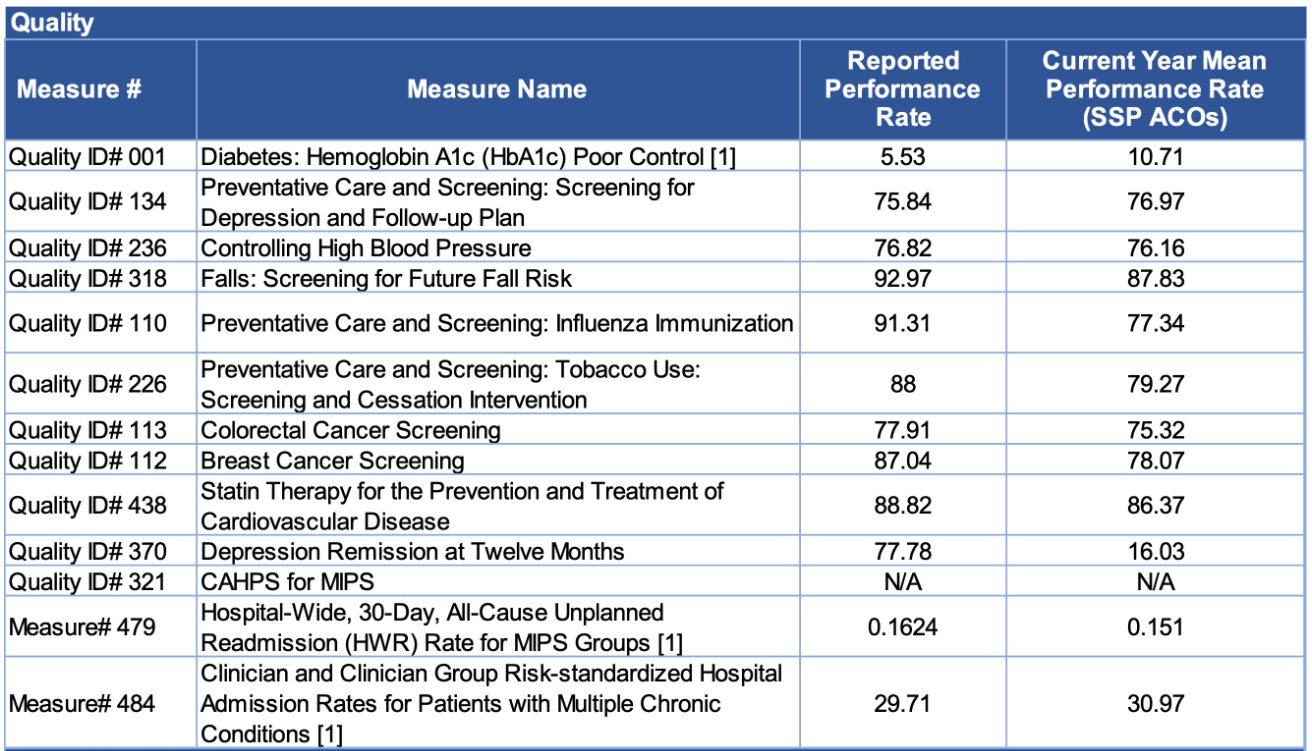
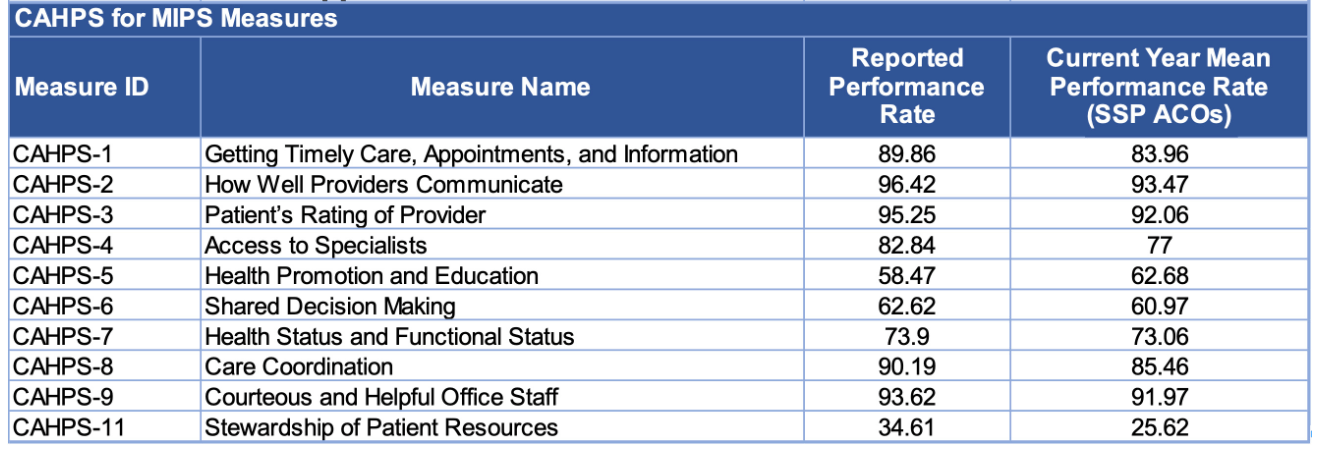
For previous years’ Financial and Quality Performance Results, please visit: data.cms.gov
Payment Rule Waivers
- Waiver for payment for Telehealth Services:
- Our ACO clinicians provide telehealth services using the flexibilities under 42 CFR § 425.612(f) and 42 CFR § 425.613.
Fraud and Abuse Waivers
- ACO Pre-Participation Waiver:
- N/A
- ACO Participation Waiver:
- N/A


